
Sucuri
Website security made simple—Sucuri offers fast malware cleanup, reliable monitoring, and powerful protection for any CMS.
付费访问网站
An open-source monitoring system with a dimensional data model, flexible query language, efficient t...
prometheus.io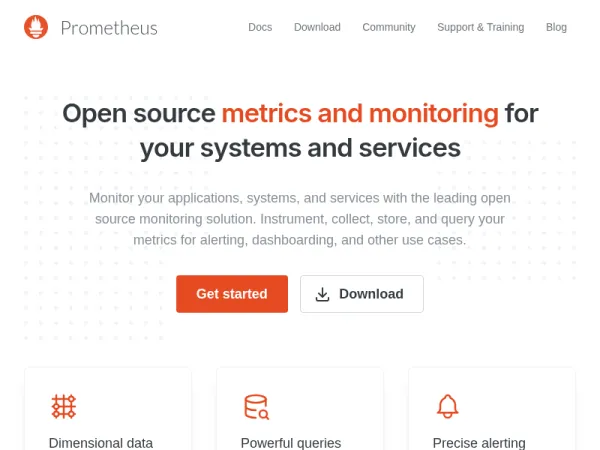
An open-source monitoring system with a dimensional data model, flexible query language, efficient time series database and modern alerting approach.
开源监控与告警系统,支持多维数据模型与强大查询语言。
运维工程师、DevOps团队、后端开发者、系统管理员
开源免费,社区活跃;
多维数据模型灵活;
PromQL查询语言强大;
与Kubernetes深度集成;
告警规则可自定义。
存储为本地磁盘,扩展需额外组件;
不支持长期历史数据存储;
学习曲线较陡;
可视化依赖Grafana。
Prometheus 是云原生计算基金会(CNCF)的毕业项目,专为动态云环境设计的开源监控与告警系统。它采用拉取(Pull)模式采集指标,支持多维数据模型(由指标名称和键值对标签定义),并通过强大的 PromQL 查询语言实现灵活的数据聚合与分析。Prometheus 自带告警管理功能,可基于规则触发通知,并集成 Alertmanager 进行去重、分组和路由。其生态丰富,与 Kubernetes、Docker 等容器平台无缝对接,是微服务监控的首选方案。虽然原生存储为本地磁盘,但可通过 Thanos 或 Cortex 实现长期持久化。适合需要实时监控、快速故障定位的运维场景,尤其适合云原生架构。
Website security made simple—Sucuri offers fast malware cleanup, reliable monitoring, and powerful protection for any CMS.
A comprehensive free SSL test for your public web servers.
Avoid lock-in and ensure reliability with Grafana Cloud. The AI-powered platform built on open standards unifies metrics, logs, traces, profiles, and business data.
Pingdom是安全运维领域的网站安全检测与可用性监控服务,功能实用、使用便捷。
Start monitoring in 30 seconds. Use advanced SSL, keyword and cron monitoring.
使员工、应用和网络在任何地方都更快、更安全,同时降低复杂性和成本。
SecurityHeaders是安全运维领域的网站安全检测与可用性监控服务,功能实用、使用便捷。
Nagios是一款开源IT基础设施监控工具,可监控服务器、网络、应用等,拥有25年以上历史,全球超100万用户。